Can intangible measures, such as freedom and happiness, be effectively measured?
Introduction:
Happiness and freedom are subjective experiences, shaped by cultural and societal factors, making their definitions vary across countries and cultures. Freedom is often understood as the ability to make decisions and pursue goals without external constraints. However, different societies may have diverse perspectives on freedom, such as religious or political freedoms. Similarly, happiness can be influenced by cultural values, with some emphasizing material success and achievements, while others prioritize interpersonal relationships or spiritual well-being. Consequently, attempting to measure freedom or happiness through standardized scores can be challenging due to the subjective nature of these concepts and their contextual nuances. However, various methodologies exist to assess and compare subjective well-being and freedom, utilizing surveys, indicators, and qualitative assessments. While these measurements offer insights, it is important to recognize the limitations and complexities involved in capturing the richness and diversity of individual experiences and societal contexts.
Research question:
Can intangible measures, such as freedom and happiness, be effectively measured?
About the data:
To answer my research question, I will use two primary data sources. Firstly, The World Happiness Report dataset, published by the Sustainable Development Solutions Network. the data is collected from individuals worldwide to assess their happiness levels on a scale of 1 to 10. This report ranks countries and examines the impact of various policies on people’s well-being.
Secondly, the Human Freedom Index (HFI) dataset will be employed. The HFI measures economic, civil, and personal freedoms across different countries. It assumes that high economic freedom correlates with high personal freedom, encompassing aspects such as freedom of speech, religion, and movement. The HFI is jointly published on an annual basis by the Cato Institute, The Fraser Institute, and the Liberals Institute.
Additionally, to gain a comprehensive understanding of freedom beyond what the Human Freedom Index offers, other global social indicators will be considered. These include the Gender Inequality Index (GII), the human development index (HDI), and indicators related to work opportunities for men and women. By incorporating these measures, the aim is to shed light on how they contribute to the Human Freedom score and potentially influence its magnitude.
Plan for Analysis:
My analysis consists of two parts.
In the first part, I will utilize Tableau to create visualizations that explore the relationship between happiness and various measures. These visualizations will help in understanding how different factors correlate with the happiness scores of different countries. Through interactive graphs and maps, I aim to provide insights into the patterns and trends between happiness and the selected measures.
In the second part, I will utilize Python to combine the Human Freedom Index (HFI), Gender Inequality Index (GII), human development index(HDI), and work opportunities data for men and women. I will apply data cleaning and pre-processing techniques to ensure the accuracy of the data. Next, I will employ linear regression models, logistic regression models, and a machine learning logistic regression approach to examine whether the GII, work opportunities for men and women, and other factors can explain the Human Freedom (HF) score and potentially contribute to its increase.
There are the links to my Python Colab notebook and Tableau visualizations for reference and further exploration:
Results:
1. Tableau results:
2. Python Results:
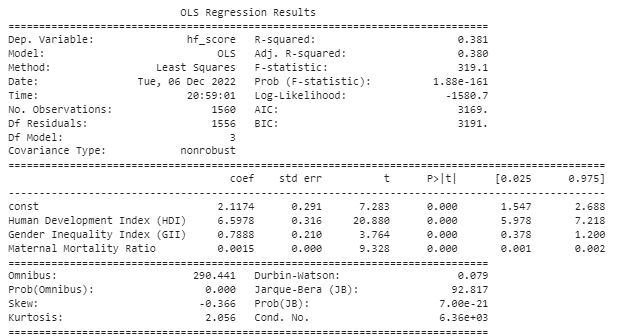
From the results of the OLS regression model, we can see that the F-test has a probability of 5.872e+04 which is less than 0.05. This means that the model is reliable.
The R-squared is 0.38, meaning that 38% of the variation in the Human Freedom Score is explained by the GDI, GII, and MMR variables.
From the significance tests for the predictors, we can see that the probabilities of the 3 variables are less than 0.05. Meaning that there is a statistically significant association between these variables and the HF- Score variable.
The coefficient of the GDI variable is 6.5978. This means that for a one-unit increase in the GDI variable, there would be an increase in the Human Freedom Score of 6.5978.
The coefficient of the GII variable is 0.7888. This means that for a one-unit increase in the GII variable, there would be an increase in the Human Freedom Score of 0.7888.
The coefficient of the MMR variable is 0.0015. This means that for a one percent increase in the MMR variable, there would be an increase in the Human Freedom Score of 0.0015.

From the results of the logit regression model, we conclude that:
The LLR p-value is 2.923e-31, which is less than 0.05. This means that the model is reliable.
The Pseudo R-squared value is 0.06, This means that the HDI and GII predictor variables do a good job of predicting the value of the response variable HF-Score.
Both the HDI and GII variables have a p-value of 0.000, which is less than 0.05, meaning that there is a statistically significant relationship between these variables and whether or not a country has scored a high human freedom score.
The model indicates that the odds of scoring a high human freedom increase by a factor of 0.12 for a unit increase in the HDI index. The model also indicates that the odds of scoring a high human freedom increase by a factor of 12.91 for a unit increase in the GII index.

The results of the logistic regression using the HDI and the GII as explanatory variables show that:
The confusion matrix shows that the modal made:
410 true positive predictions. 163 true negative predictions. 48 false positive predictions. 159 false negative predictions.
The accuracy score is 73%, meaning that the modal made 73% of correction predictions. This tells us that the model made the correct prediction for whether or not a country would have a high HFI 73% of the time.

The results of the logistic regression using the GII and the MMR as explanatory variables show that:
The confusion matrix shows that the modal made:
245 true positive predictions. 59 true negative predictions. 26 false positive predictions. 138 false negative predictions.
The accuracy score is 65%, meaning that the modal made 65% of correction predictions. This tells us that the model made the correct prediction for whether or not a country would have a high HFI 65% of the time. This seems to be a small accuracy score, but it is still important.
Conclusion:
The analysis reveals that measures such as the Gender Inequality Index and Maternal Mortality Ratio play a significant role in explaining and increasing the Human Freedom Score. Additionally, the concept of happiness and freedom varies from one country to another and differs among individuals. The challenge lies in how we can effectively quantify and datafy these intangible measures. Therefore, efforts towards measuring and datafying these intangible concepts should be approached with sensitivity and a holistic understanding of the unique factors influencing happiness and freedom in different contexts.